Observability
With the cluster running and services exposed, I had no visibility into what was actually happening inside. Time to fix that.
Design
Here's the high-level observability architecture running in my Kubernetes cluster:
The observability pipeline in my cluster is designed around the idea that different types of data have different collection needs.
Grafana Alloy runs in clustered mode as a Deployment, using discovery.kubernetes blocks to discover targets and scrape pod metrics (read here about why I'm using Alloy instead of Prometheus).
I also decided to route log collection through Alloy.
While logs could technically be gathered locally on each node, Alloy’s log processing features , e.g. structured metadata creation, were good enough that it made sense to consolidate that work there.
Not all data benefits from this centralized approach, though. For high-volume or latency-sensitive sources, I use node-local collection to minimize cross-node traffic. The OpenTelemetry Collector runs as a DaemonSet and scrapes containerd metrics directly on each node. Beyla, also running as a DaemonSet, attaches via eBPF to capture application traces without requiring code instrumentation, forwarding traces and metrics to their respective storage backends through the OpenTelemetry collector.
One nuance in this design is how trace-derived metrics from Beyla are handled. The number of series generated by Beyla ~50% of all ingested by the cluster, so they're stored under a separate Mimir tenant. This will allow for per-tenant overrides in the future, if necessary.
This separation, combined with the split between centralized and node-local collection, keeps the core observability pipeline lean while still giving me fine-grained insight into the cluster.
Basic Observability
Before putting the full observability stack in place, I wanted a way to verify that what I was collecting matched what the cluster was actually experiencing in real time.
The simplest approach was to start with the Kubernetes Dashboard and the metrics-server.
The metrics-server gives you access to live resource usage data straight from the kubelet, which makes it perfect for quick sanity checks.
With it running, the kubectl top command and the dashboard’s built-in resource views become an immediate point of comparison against the values being scraped by my observability pipeline.
While this setup was essential for validating my metrics early on, the metrics-server also plays a long-term role in the cluster. It’s the standard source of resource metrics for Kubernetes Horizontal Pod Autoscalers, allowing workloads to scale up or down based on CPU and memory usage without any extra configuration. This means that even after the rest of the observability stack is in place, metrics-server continues to serve as both a validation tool and a core component for workload autoscaling.
Out of the box, it didn’t quite work, given my networking setup - the API server needed to trust my custom certificates.
To resolve this, I used the tls configuration block, specifying the StepClusterIssuer I had already created:
tls:
    type: "cert-manager"
    certManager:
    addInjectorAnnotations: false
    existingIssuer:
        enabled: true
        kind: "StepClusterIssuer"
        name: "step-issuer"
Once that was in place, things just worked:
>kubectl top nodes
NAME       CPU(cores)   CPU(%)   MEMORY(bytes)   MEMORY(%)
giselle    5575m        70%      15603Mi         66%
irene      1015m        17%      5403Mi          47%
joy        2617m        43%      9009Mi          58%
karina     2294m        38%      4881Mi          43%
ningning   2278m        28%      10870Mi         46%
seulgi     795m         20%      3033Mi          55%
wendy      7611m        63%      27474Mi         57%
winter     4436m        55%      17569Mi         74%
yeri       3332m        56%      6286Mi          40%
Ingesting Logs
With the baseline metrics in place, the next step was to get log collection up and running. For this, I chose Loki as the backend. Loki’s index-free design keeps storage costs low while still letting me query across large volumes of logs, which is ideal for a self-hosted setup. Given my relatively low ingestion volume, I deployed it in simple scalable mode. This keeps the deployment footprint and operational complexity small while still allowing the system to scale out later if needed.
On the collection side, I configured Grafana Alloy to tail logs directly from Kubernetes pods with discovery.kubernetes and loki.source blocks:
discovery.kubernetes "pods" {
    role = "pod"
}
loki.source.kubernetes "pods" {
  targets    = discovery.kubernetes.pods.targets
  ...
}
Alloy’s log pipeline features — particularly its relabeling, parsing, and field extraction — made it a strong choice for handling logs before they hit Loki. In my setup, all applications run in debug mode by default, but the debug-level logs are dropped at the collection layer. This means I pay a small CPU cost for tailing those extra lines, but the tradeoff is flexibility: if I ever need full debug output from a service, I can update the Alloy configuration and immediately start forwarding debug logs to Loki without touching the application itself. No restarts, no redeploys — just a quick config change and the extra detail is live.
This approach also gives me the opportunity to enrich logs before they’re stored. Alloy automatically attaches Kubernetes metadata such as pod name, namespace, and container image, and it can normalize log formats so that queries in Loki are consistent regardless of the application’s original logging style. Combined with autodiscovery, this means new workloads start streaming enriched, filtered logs into Loki as soon as they hit the cluster, with minimal operational overhead.
Ingesting Metrics
With logs flowing into Loki, the next layer to set up was metrics. Detailed information about the metric collection can be found here, so I'll summarize it quickly:
- cluster-wide metric endpoint autodiscovery is handled by Alloy
- the OpenTelemetry collector scrapes containerd metrics
All metrics flow into Grafana Mimir, which I have deployed in microservices mode. In practice, I run it with far fewer resources than the default Helm chart suggests, since my workload doesn’t require the full reference capacity. The main tuning challenge hasn’t been CPU or memory — it’s network throughput. My hosting provider, Contabo, caps each node at 100 Mb/s, so I’ve set relatively high replica counts for certain components to spread the traffic load. This keeps ingestion and query performance stable even when there’s still unused CPU headroom but the bandwidth limit is in play.
To ensure that ingester pods are placed properly, I use the following topologySpreadConstraints along with affinity:
topologySpreadConstraints:
    - maxSkew: 1
      topologyKey: kubernetes.io/hostname
      whenUnsatisfiable: ScheduleAnyway
      labelSelector:
        matchLabels:
          app.kubernetes.io/component: ingester
      matchLabelKeys:
        - pod-template-hash  # This helps with rolling updates

  affinity:
    podAntiAffinity:
      # Soft preference: try to spread pods across nodes
      preferredDuringSchedulingIgnoredDuringExecution:
        - weight: 100
          podAffinityTerm:
            labelSelector:
              matchExpressions:
                - key: app.kubernetes.io/component
                  operator: In
                  values:
                    - ingester
            topologyKey: 'kubernetes.io/hostname'
This allows a best-effort distribution of the ingesters evenly among the nodes, without fully restricting scheduling if nodes are not available.
Ingesting Traces
The final piece of the observability stack is tracing, which ties together the metrics and logs into a cohesive view of application behavior. Beyla runs on every node, using eBPF to capture trace data without requiring any changes to application code. In addition to traces, Beyla also emits associated metrics and log context, so a single request can be followed across all three observability pillars. All of this data is sent to a node-local OpenTelemetry Collector.
The OTEL Collector acts as the central router for tracing data. It exports spans to Tempo, sends trace-derived metrics to Mimir, and pushes any relevant logs to Loki. This ensures that the same request can be explored from multiple angles — from its raw logs, to aggregated metrics, to a detailed span breakdown — all linked by the same context.
Tempo is configured to generate service graphs, which are then written back into Mimir as metrics. This creates a feedback loop between tracing and metrics: I can spot service-to-service latency or error patterns in a dashboard, then drill into the trace data in Tempo to see exactly where in the request path the issue originates. With Beyla providing the raw visibility, the OTEL Collector directing traffic, and Tempo, Mimir, and Loki each handling their respective data types, the cluster has a full observability pipeline where every signal reinforces the others.
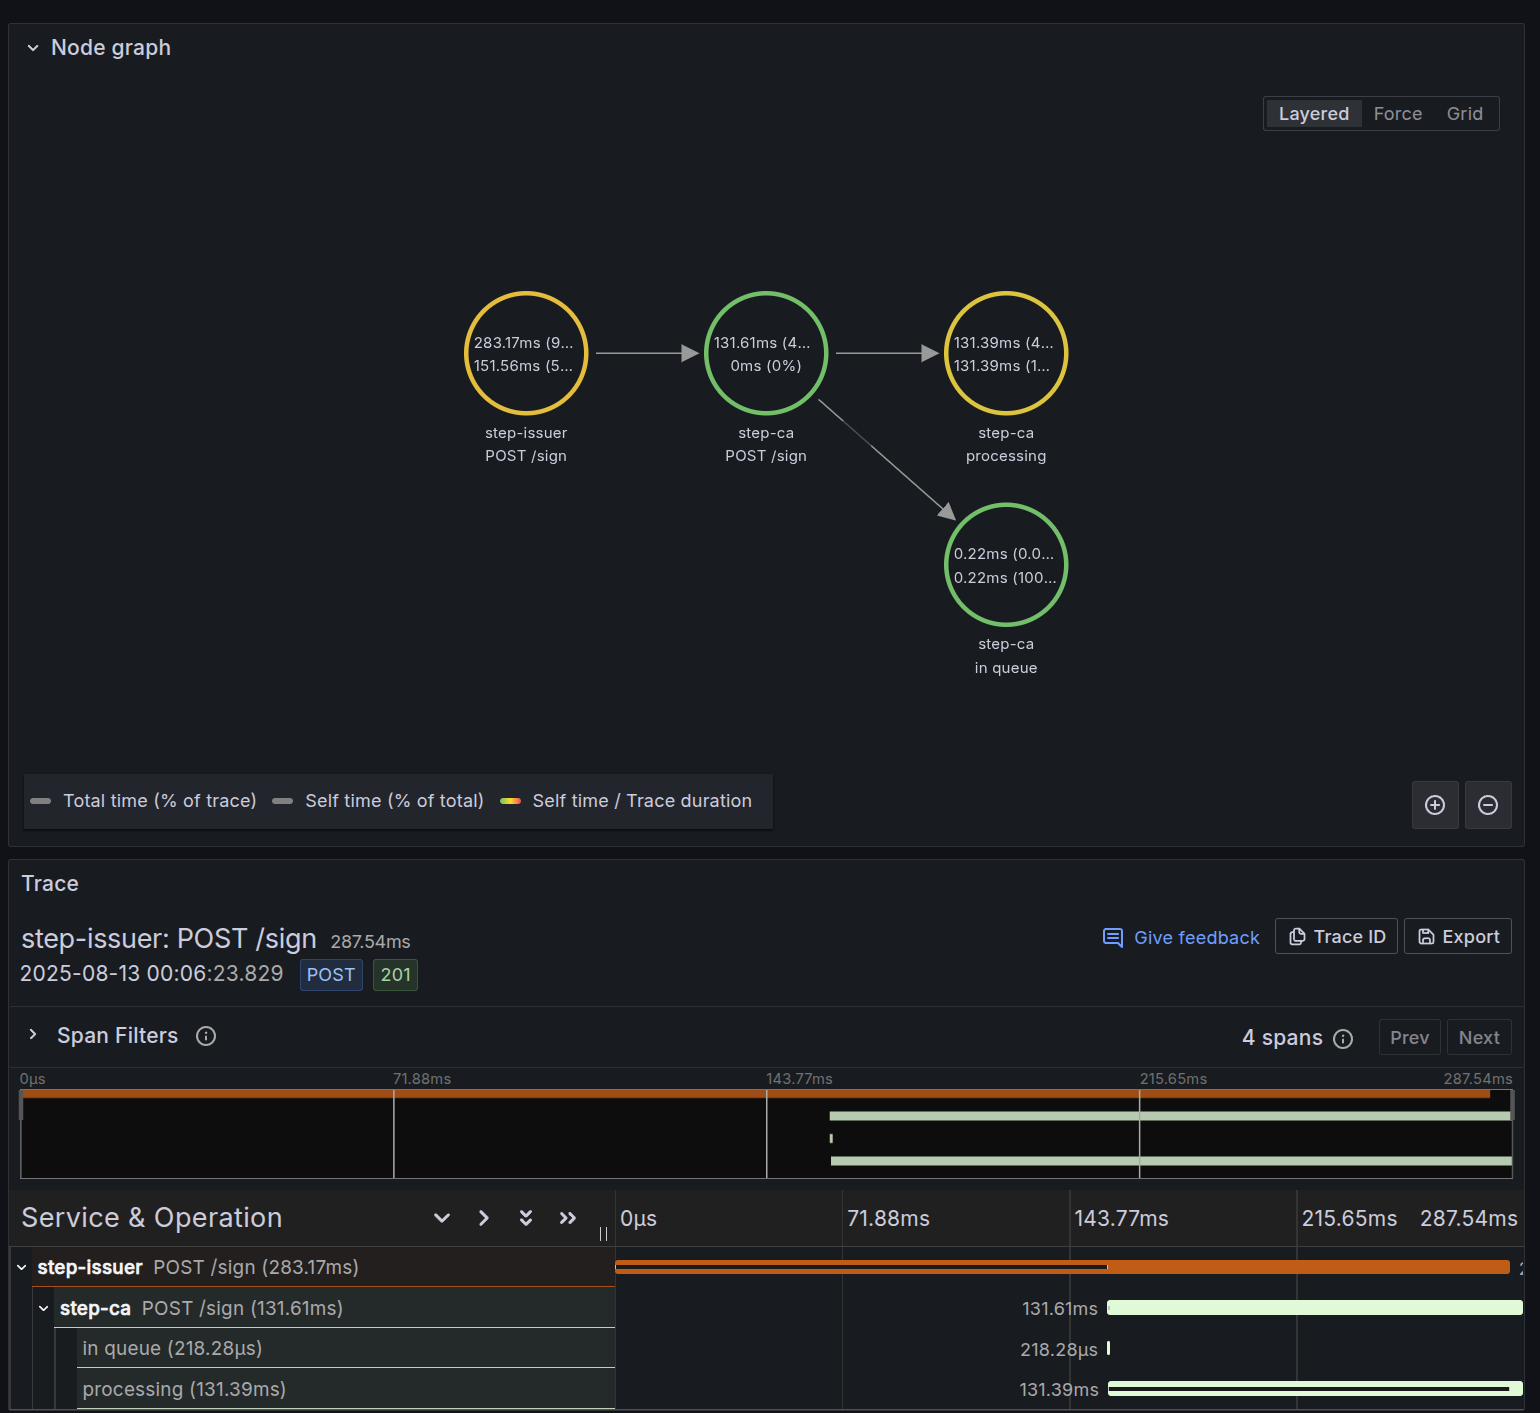
Below is a screenshot of the service graph capability along with the trace data for a /sign request from step-ca:
Closing Thoughts
Overall, this setup has proven to be a solid, reliable foundation for observability in my cluster, covering metrics, logs, and traces in a way that’s both practical to operate and easy to extend. There’s still room to grow — adding exemplars would make it even easier to pivot directly from metrics to traces, and integrating tools like Parca and Pyroscope would bring continuous profiling into the mix. But even as it stands, the system delivers the visibility I need while leaving a clear path for future enhancements.