Status Page
After setting up observability in my Kubernetes cluster, I had detailed metrics and logs for everything. But when something breaks in the middle of the night and I'm barely awake, I don't want to navigate Grafana dashboards. I needed something I could glance at and immediately know what's broken: status pages that show green or red, nothing more.
I set up two: one internal for cluster components, one external for public-facing services. After evaluating a few options, I went with OneUptime—which provided the at-a-glance simplicity I needed, but came with integration challenges around ClickHouse, custom certificates, and GitOps with ArgoCD.
Why OneUptime?
I'm familiar with Atlassian Statuspage from work and like the approach, so I wanted a FOSS alternative that could give me similar functionality. The requirements were straightforward: at-a-glance status display, support for multiple monitors, and high availability. That last one was the real filter. CPU clock cycles are cheaper than my time, so I care deeply about high-availability and self-healing architecture. If the status page itself goes down, I want it to recover automatically without me scrambling to fix it.
That ruled out most of the simpler options. Uptime Kuma and Gatus are great tools, but they don't support high-availability deployments. cState is static-only, so no dynamic monitoring. Others that could handle it, like OpenStatus, didn't have Helm charts, which would mean significantly more work to integrate with my GitOps setup.
That narrowed it down to OneUptime and Apache Hertzbeat, both of which checked all the boxes. I chose OneUptime largely because it had more active development and better documentation at the time.
Adding Kyverno
I opted to use out-of-chart integrations for OneUptime, deploying ClickHouse using the Altinity operator, which was straightforward. The real integration challenge came when setting up probes—OneUptime doesn't provide an easy way to inject custom CA certificates, so probes couldn't trust my internal services.
To accomplish this, I installed Kyverno and trust-manager, which watches a Certificate and generates a ConfigMap containing a trust bundle:
apiVersion: trust.cert-manager.io/v1alpha1
kind: Bundle
metadata:
  name: stepca-certs-bundle
  ...
spec:
  sources:
  - configMap:
      name: "step-certificates-certs"
      includeAllKeys: true
  target:
    configMap:
      key: "stepca.pem"
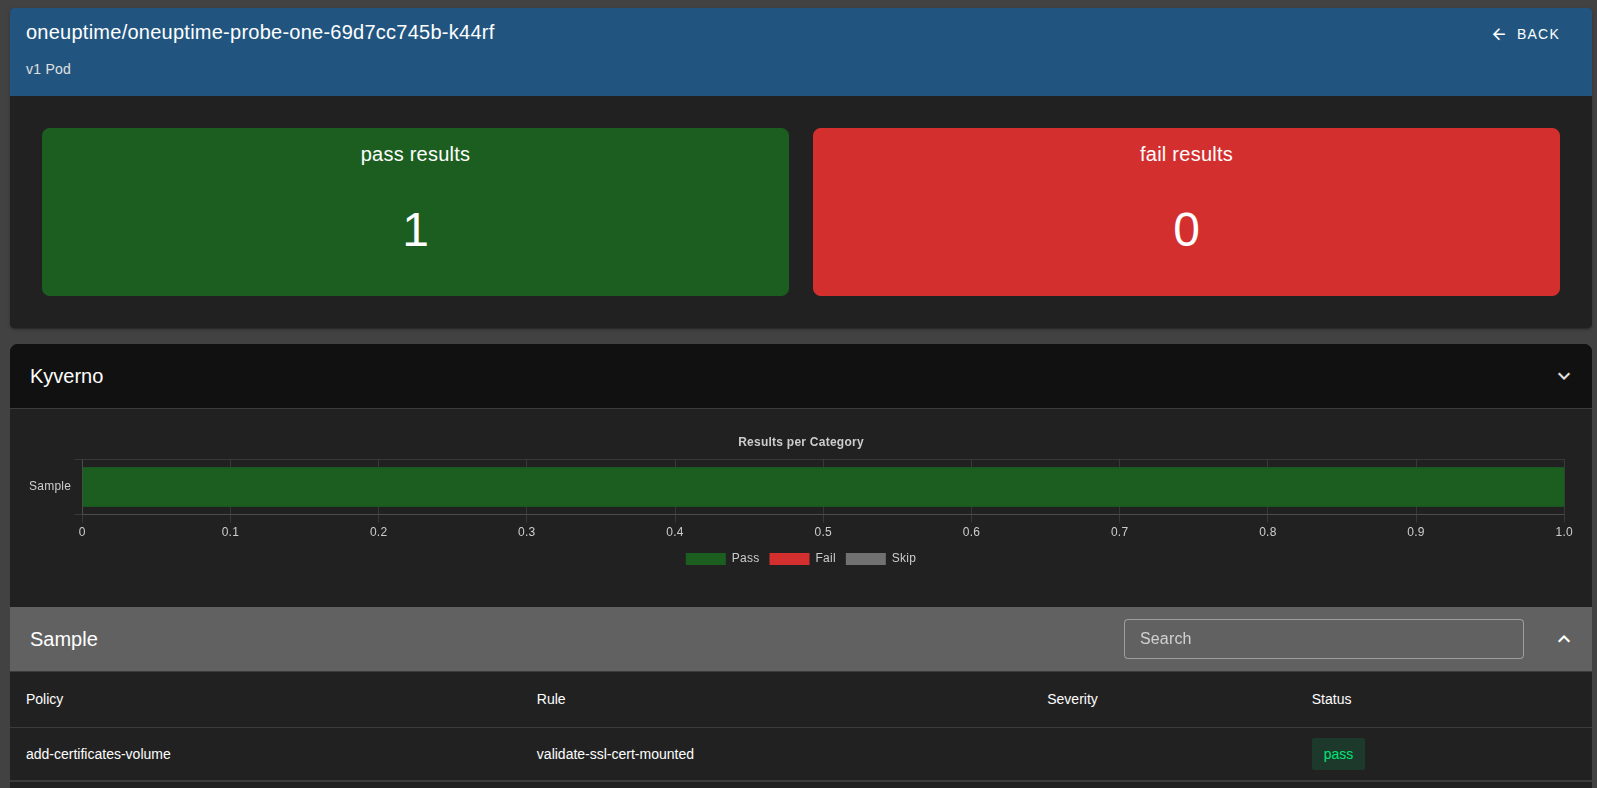
Kyverno then uses that bundle in a policy to mount the correct CA into the probe container.
apiVersion: kyverno.io/v1
kind: ClusterPolicy
metadata:
  name: add-certificates-volume
  ...
spec:
  background: false
  rules:
  - name: add-ssl-certs
    match:
      ...
    mutate:
      foreach:
      - list: "request.object.spec.containers"
        patchStrategicMerge:
          spec:
            containers:
            - name: "{{ element.name }}"
              volumeMounts:
              - name: etc-ssl-certs
                mountPath: /etc/ssl/certs/ca-certificates.crt
                subPath: stepca.pem
                readOnly: true
            volumes:
            - name: etc-ssl-certs
              configMap:
                name: stepca-certs-bundle
                namespace: default
I also added Kyverno's policy-reporter to report on the status of this policy, using a validation rule paired with the above mutation rule.
Installing OneUptime
I installed OneUptime using its Helm chart, but it needed a bit of customization to work well with ArgoCD and my environment.
First, I created a Kubernetes Secret containing oneuptimeSecret and encryptionSecret.
This secret is critical because it's used to encrypt data in the database - if it changes, existing data becomes unreadable.
The chart normally generates these values randomly, so I had to supply them explicitly to ensure consistency across upgrades and syncs.
Then, in the values.yaml, I set probes.<num>.key to use a static UUID, since that value is also randomly generated by default.
I also configured the chart to use my external PostgreSQL and ClickHouse instances instead of provisioning its own.
externalSecrets:
  oneuptimeSecret:
    existingSecret:
      name: oneuptime-external-secrets
      passwordKey: oneuptimeSecret
  encryptionSecret:
    existingSecret:
      name: oneuptime-external-secrets
      passwordKey: encryptionSecret
probes:
  one:
    key: <uuid>
postgresql:
  enabled: false
externalPostgres:
  ...
clickhouse:
  enabled: false
externalClickhouse:
  ...
Finally, I added the chart via ArgoCD using a Kustomize overlay, where I patched in the NODE_EXTRA_CA_CERTS environment variable (so probes would trust my internal certs) and removed the /spec/template/metadata/labels/date field to prevent unnecessary pod restarts on every sync:
patches:
  - target:
      kind: Deployment
      name: oneuptime-probe-one
    patch: |-
      - op: add
        path: /spec/template/spec/containers/0/env/-
        value:
          name: NODE_EXTRA_CA_CERTS
          value: "/etc/ssl/certs/ca-certificates.crt"
  - target:
      group: apps
      version: v1
      kind: Deployment
    patch: |-
      - op: remove
        path: /spec/template/metadata/labels/date
Setting up the Status Pages
Once OneUptime was running, configuring the actual status pages was straightforward. OneUptime has solid documentation for setting up probes, monitors, and the required DNS records, so I won't rehash that here.
The one piece specific to my setup was reverse-proxying the external status page. I wanted status.fosspilled.dev to be publicly accessible without exposing the actual cluster IPs, so I set up an nginx reverse proxy on the server running this site, pointing to the cluster's URL oneuptime.prod.service.testlab.kube, using my custom DNS server.:
    server {
        server_name status.fosspilled.dev;
        resolver xx.xx.xx.xx valid=600s;
        set $backend "oneuptime.prod.service.testlab.kube";

        location = / {
            proxy_pass https://$backend/status-page/<statusPageID>/;
            proxy_set_header Host oneuptime.prod.service.testlab.kube;
            ...
        }

        location / {
            proxy_pass https://$backend;
            proxy_set_header Host oneuptime.prod.service.testlab.kube;
            ...
        }
    }
The root path (/) proxies directly to the status page, while other paths (JavaScript assets, API calls, etc.) route to the main OneUptime ingress. This keeps the public status page isolated while still allowing it to fetch the resources it needs.
Closing Thoughts
OneUptime delivered what I needed, but the integration was rougher than this walkthrough suggests.
The Helm chart has some design choices that actively fight GitOps workflows. By default, it injects a timestamp into pod metadata labels on every render, which causes ArgoCD to see the deployment as out-of-sync and trigger constant pod restarts. The fix is simple if you know what you're doing—strip the label with a Kustomize patch—but it's not documented anywhere, and a less experienced engineer could easily spend hours debugging why their pods keep restarting for no apparent reason.
Similarly, the chart requires explicit configuration for several mandatory fields before it'll even start, and resource consumption spikes to 500-1500m CPU on startup before settling to 10-100m at idle. Without understanding vertical pod autoscaling, you'd either under-provision (pods crash-looping) or over-provision (wasting cluster resources).
The real limitation is that OneUptime still requires manual UI configuration for some resources—not everything has a corresponding Kubernetes CRD or Terraform provider. For a homelab project this is annoying but manageable. In a company, this would be a dealbreaker.
But in my case, I have a working status page.